Tuesday, July 30, 2013

Apple Price Chart Showing Positive Developments


Something's going on with Apple.  On recent days when the market has been down or flat, Apple has undergone accumulation.  It is about to complete a well formed multi-month base similar to the one formed in 2009.  Apple's weekly chart is exhibiting bullish positive price/momentum divergence in addition to early outperformance when compared to the S&P 500.  The P&F chart is also showing a positive trend change.  It will likely find resistance at its 200-day moving average (~$462).  If it can break out from here, that would be extremely bullish.

I can't speak for new products in Apple's pipeline or how it may "change the world" again.  However, I can say that there have been recent notable bullish developments in its chart.

(Weekly price chart and P&F chart courtesy of stockcharts.com.  Visit stockcharts.com for more great charts.)

Sunday, July 28, 2013

Long Term NASDAQ Outperformance Began In The Late 1970s


There are many market similarities between present day and the late 1970s.  The late 70s early 80s saw the conclusion of a long secular bull market in commodities, similar to the late stage bull market in commodities we are currently experiencing.  One of the most overlooked comparisons between now and the 70s market is the relative outperformance of the NASDAQ.  Prior to the emergence of the broad secular bull market in the early 1980s, the NASDAQ was well on its way as early as 1978.  We are seeing a similar trend develop in the market today, however, the outperformance of the NASDAQ began immediately off of the market bottom in 2009.

I'm long the NASDAQ 100 Index through the QQQ.  It is my favourite "buy it and forget about it" holding.  I've been adding to it since 2006.

Friday, July 26, 2013

The Exponential Nature Of The Stock Market


In his book The Singularity Is Near, Ray Kurzweil eloquently summarizes some extremely interesting phenomena about the evolution of technology and how it fits with grand scale evolution.  I have read this book twice and am fascinated with the concepts contained in it and their prospective application to the financial markets.

He suggests that an exponential trend will cross "the knee of the curve" before it becomes recognizable to the average observer.  If you consider the fact that the underlying trend in the Dow Jones Industrial Average is exponential in nature, I would place the knee of the curve somewhere during the first third of the 20th century.  In other words, we're well past it and the trend will continue much higher in an accelerating fashion.

The Way Forward For US Banks And The US Financial Sector


The XLF is the largest US investment bank ETF.  It's surprising that Berkshire Hathaway (BRK) is its largest holding along with WFC, JMP, C and BAC.  BRK and WFC have been the best performing in the sector by far (BRK owns a large percentage of WFC).

From a technical perspective, the easy money has been made as it has run into significant overhead resistance that was established in the decade prior to the financial crisis.  I think XLF is an excellent long term hold, however, choppy and sideways trading is likely the way forward.

There is still opportunity for upside in more speculative financial issues such as RF, KEY, STI and AIG.  Their long term charts illustrate the tremendous destructive force of the financial crisis, erasing in some cases equity built up over decades.  I generally use call options with issues as speculative as these.

The US financial sector now sits where the DOW did in the 1930s after the 1929 crash.  The waters may still be somewhat rough, but I think it's mostly upside from here.

The S&P TSX Composite Index Will See New Highs In The Near Future


After the 1973-74 bear market, the TSE 300 (now the S&P TSX Composite Index) underwent a multiyear period of price consolidation prior to its breakout in 1978.  Do you see the similarities between now and then?  Note how bad the following 1982-83 bear market that succeeded the breakout was.  The early 80s recession was a very difficult time for Canada.

Akamai Technologies On The Verge Of Major Breakout?


The series of higher lows over a 10 year period is a very bullish sign.


The above chart is taken from the Investor's Business Daily website.

Thursday, July 25, 2013

S&P 400 Mid Cap Index Is The Intermediate Term Winner

No one would have guessed in 2009 that the S&P 400 Mid Cap Index would lead as it has post financial crisis. The charts speak for themselves.  Visit www.chartoftheday.com for more great charts.


Facebook Explodes Higher On Very Heavy Volume


Facebook has exploded, up almost 28% today on VERY heavy volume.  There are days when the entire Toronto Stock Exchange trades less than half of the volume Facebook has traded today (and the day is not over).  LinkedIn is up strongly in sympathy.  QQQ and especially FDN are up as a result.(Disclaimer:  I own FDN and QQQ)

Major European Indices Near End Of Secular Bear Market


As the three above charts show, returns on the big 3 European ETFs have been essentially zero for the past 15 years.  This is typical of a secular bear market, zero return with extreme volatility throughout.  I think the picture going forward will be quite different.

Germany (EWG) is pushing up on resistance established at the 2000 peak, the breakdown period in 2007-08 which lead to the global financial crisis and the 2011 peak established prior to the European Debt Crisis.  We could see some more sideways movement before finally moving higher but I think the lows are in.

France (EWQ) is sitting on major support established in 1998-99, 2006 and more recently in 2011.  The United Kingdom (EWU) has a similar chart.  Both are sitting on key Fibonacci retracement lines.


https://en.wikipedia.org/wiki/Fibonacci_retracement

Wednesday, July 24, 2013

Facebook Up 17% After Hours, LinkedIn Trend Is Up, FDN Is The Best Way To Play Them Both


Facebook finally posted earnings results that beat estimates and will be rewarded by the market tomorrow.  However, its social networking cousin, LinkedIn, seems to be the better play.

Despite the fact LinkedIn is a fraction of Facebook's size,  it has far more predictable earnings and revenue growth data and is likely to continue its smooth growth in the future as it continues to implement more revenue generating service offerings to its members.


It is extremely hard to determine the likelihood of success of a given social network or high P/E multiple internet company.  FDN is an ETF that tracks the Dow Jones Internet Composite Index. Although it has a more modest MER of 0.60%, it is worth every penny over the long term.

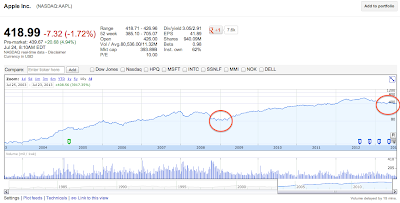
Is Apple Preparing For Another Leg Up?


Apple is up in the premarket today after reporting earnings that we're not quite as bad as analysts had suggested after many downward revisions.  The market has responded modestly and it should open up ~5% today.  Whether or not it holds is another story and is largely dependent on the broad market.  Regardless, the market has more or less written Apple off completely.  With almost $400B in market cap, a P/E of 10 and a dividend yield of 2.8%, the market is pricing it like a utility company not a tech company.  Over the past several months, it has formed a base pattern similar to that in 2009.  Maybe I'm just seeing things...

Tuesday, July 23, 2013

Brazil China And Emerging Markets Hold Major Support


China (FXI), Brazil (EWZ) and the entire Emerging Market MSCI Index (EEM) have bounced off of major technical support levels that reach back to 2006.  This is coinciding with the rebound in commodity stocks.  They should all move higher from here.

Cisco Moving Higher For The Long Term

CSCO broke out of a period of price consolidation in late 2012.  Expect resistance at ~$30.

QQQ Continues To Lag S&P 500. PerfChart QQQ SPY EEM XLF IWM MDY FDN IBB XIU

Mega cap tech stocks (QQQ) have been lagging the S&P 500 for most of the year, largely due to the poor performance of a few big names (i.e. AAPL, MSFT, INTC).  Biotechnology (IBB), on the other hand, is way out front.

Monday, July 22, 2013

Microsoft Is A Screaming Buy


The market has unfairly punished Microsoft.  The options market is currently undervaluing it to a ridiculous degree.  April 2014 calls offer tremendous value.  I'll be buying them.  It is sitting on 10+ year support.