Showing posts with label great depression. Show all posts

Thursday, August 26, 2010

A Global Depression?


The iShares Global 100 (IOO) which tracks the S&P Gobal 100 Index, is essentially a picture of the global economy on one chart. It consists of 100 large cap international stocks. It is to the world what the DOW is to the United States. Several of its holdings are DOW components due to the dominant presence of the US in the global economy.

We can see from the chart that after a sharp recovery from March 2009 to Jan 2010, the chart has faltered and has retested break out level support at $50. We could test this strong support level again or trade at or near it for a period of time. A break below this support level would signal another global recession and a break below $40 would signal a global depression.

Economics is a progressive discipline, not a regressive discipline. Economies learn from past mistakes and become more efficient as time progresses, not less efficient. It is true that history seems to sometimes repeat itself as bubbles form and subsequently burst intermittently. However, this is due to the nature of human psychology, not ecomonics. Progress is cumulatively exponential in nature. The long term trend is always up.

Despite the intensely negative media reports, looking back 10 years from now, this could be the greatest buying opportunity of a generation.

Wednesday, August 25, 2010

The Good Depression

Things seem very bad right now.

All of the news media is extremely negative. This latest correction has very quickly brought all of the superbear doom and gloom economists (i.e. David Rosenberg, Nouriel Roubini, Eric Sprott, Robert Prechter, etc.) out of the woodwork once again to preach about The Demise of the United States, the Elimination of the Middle Class, the Continuing Decline of the US Housing Market, Rising Unemployment, and the fact that gold is the only safe place to be. There is even talk of war to stimulate the economy. It's almost as though there is a competition among analysts to see who can be the most negative or create the best negative brand. You may recall that the opposite was true in 2000, when it was cool to be positive.

Technically speaking, Japan has been in a "depression" since 1990. Currently, the Nikkei is en route to retest its 2008 bear market lows. If this correction worsens, Japan will lead us into the abyss. Fortunately, despite being in a 20+ year depression, Japan is a very nice place to live. They have the world's longest life expectancy, the best social programs for its citizens and are a much more culturally cohesive society that Europe or the west. I'd like to live in Japan, despite it being in a depression.

Yesterday, on the Lang and O'Leary exchange, Amanda Lang questioned David Rosenberg as to what an ordinary investor can do to protect themselves during another depression. Although Mr. Rosenberg may be a well seasoned and respected economist, his answer was poor. He argued that we're likely two thirds the way through this secular bear market which began in 2000. He recommended adopting laddered bond strategies to maximize yield and adopting long / short equity strategies to protect from a declining stock market. I'm skeptical that these strategies actually work to provide better than average returns over the long run. As a general rule, the more complex your investing strategy is, the poorer your long term results. I'd like to know David Rosenberg's 10-year portfolio return.

At least we'll know we're at the end of the Good Depression when the big banks start routinely selling laddered bond funds and long / short equity mutual funds to retirees.

Thursday, August 19, 2010

Where is the market headed?


It is remarkable how much the 1930s DOW chart resembles the NASDAQ 2000s chart. The boom and bust nature of the roaring 20s and the technology boom of the 80s and 90s illustrates the fact that human psychology remains at least one constant in the stock market.

From their inception, both the early DOW and NASDAQ experienced years of uninterrupted growth before making their final parabolic moves and then subsequent crashes. The DOW took 12 years to fully "correct" before resuming a long term uptrend that began in 1942. We are 10 years into the NASDAQ's long term period of price consolidation. The real question is how much more time is required for the NASDAQ to fully consolidate and are we headed lower first?

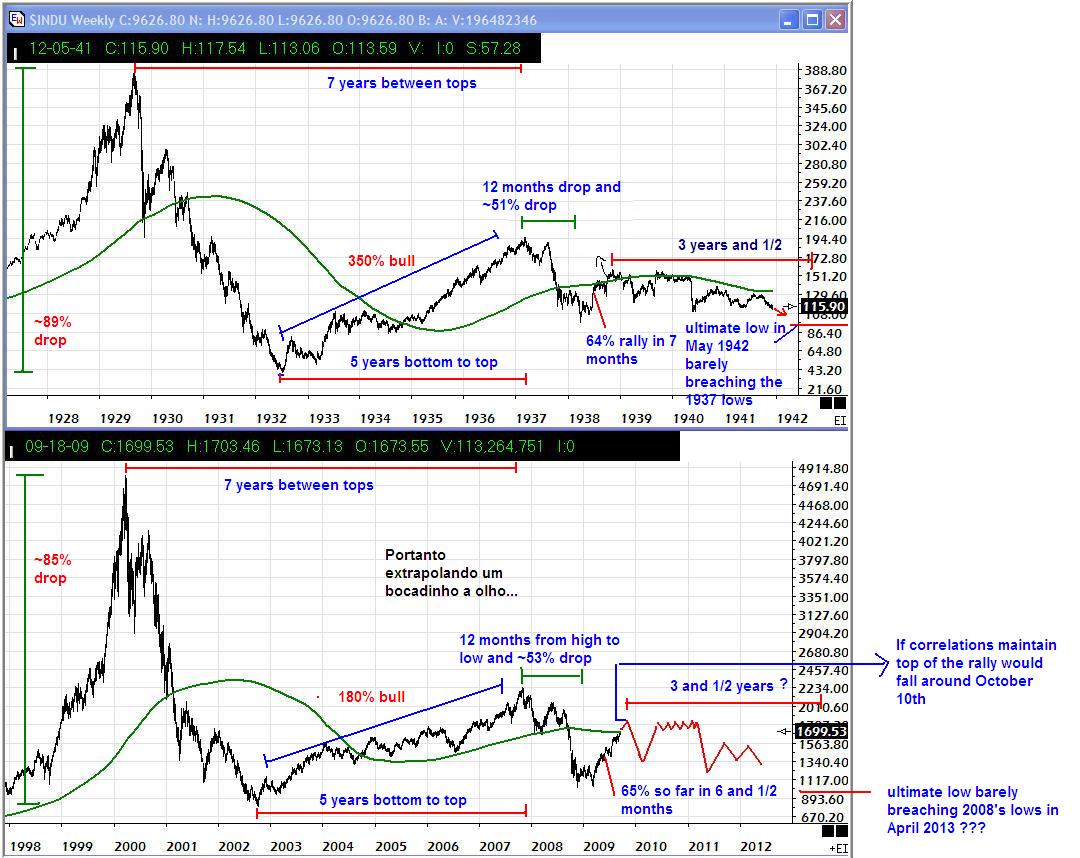
One striking difference between these two charts is the magnitute of their second bull run after their massive crashes. After correcting 89% from its peak, the DOW broke out of a 3 year base pattern and moved up 380%. The DOW subsequently came back to test the 100 point level in 1938 and one final time in 1942 after which a long term uptrend resumed. The NASDAQ, however, moved up a mere 180% after its crash only to break support and retest its crash lows in 2009.

What does this mean? After a significant 380% rebound, it took two retests of the 1935 break out level support at ~100 to wash out all weak investors and the DOW to finally break out in 1942 and never look back. With respect to the NASDAQ, all of the weak holders were washed out in 2008 by a near retest of the 2002 crash lows. A second retest of the 2002 crash lows is unlikely. Support is more likely to hold near 2000 points or slightly below this level. The chart above suggests the NASDAQ will lack direction and drift to the old lows. I don't think so but anything is possible.

So perhaps it takes a year or two more before the NASDAQ defines itself as the true market leader once again. What's more important is the long term uptrend that will follow. In approximately 60 years, the DOW surged 1000% or two exponential steps. It stood at 100 points during the 1940s, moved up by one exponential step to 1000 points during the 1970s, and subsequently moved by another exponential step to 10 000 points by the year 2000. Each exponential move required approximately 20 years to complete, followed by a 10 period of price consolidation.

The NASDAQ currently sits at ~2000 points. By 2020 the NASDAQ should make one exponential step to 20 000 points and then enter a period of price consolitation during the 2030s. The uptrend will then resume in approximately 2040 with the NASDAQ reaching a remarkable 200 000 points, a second exponential step, by 2060 give or take a few years.

What's more interesting is where the other indicies will be given these time frames. Following the same trend, the S&P 500 and DOW shoud reach 10 000 and 100 000 points respectively by 2030. The following exponential step would bring the S&P 500 to 10 000 points and the DOW to a whopping 1 million points by the year 2060.

Sounds silly right? Imagine, how many people would have believed you if in 1942 with the Great Depression fresh in the entire world's mind, you made a prediction that the DOW which then stood at a mere 100 points, would reach 10 000 points by the year 2000?

This is the nature of exponential growth.