Showing posts with label nasdaq. Show all posts

Monday, September 23, 2019

Nasdaq 10000 by the end of 2020? 2.618 Fibonacci extension target is ~13000

It has been a while folks.  Anyway here goes:

I think the Nasdaq is going to leave the 1.618 extension of its 2000 high behind and head to the next extension level (2.618).  Rounding the 2000 high to 5000 and the 1.618 extension to ~8100 (which we have been trading around since Feb 2018) the 2.618 extension would bring us to approximately 13000.

It took the Nasdaq 18 years to reach the 1.618 extension level.

The 2000 - 2015 Nasdaq base is gigantic.  It's possible that the breakout has just begun.


Sunday, May 21, 2017

Nasdaq 2017 = Dow Jones Industrial Average 1950s? Ultra bull market ahead?

Looking back it wasn't surprising that the US stock market would enter a correction at the Nasdaq 5000 range.  This was the previous year 2000 top (~5200).  Breaking through this level required more conviction on behalf of the market as it signified the Nasdaq was finally leaving the dot.com bubble top behind it.  Market watchers have been focusing on Dow 20000 and S&P500 2400 but I think the Nasdaq is the index to watch.

After the 1929 top, the Dow finally reached new ATHs in the early 1950s AFTER which a 18 year bull market followed until concluding in 1968.  The post 2000 Nasdaq has a very similar chart to the post 1929 Dow.  Some differences being that consolidation in the Nasdaq post 2000 was more constructive and shorter in duration than Dow consolidation during the Great Depression.  From absolute top to bottom the Nasdaq corrected less than the Dow and reached new ATHs sooner.  One can suggest that the modern Nasdaq has shown more resilience than the 1930s Dow.  If the Nasdaq follows a similar pattern of Dow 1950 we can expect a long and powerful bull market ahead.

Monday, April 11, 2016

Bearish sentiment is reaching extremes in some areas of the market. Is it time to be contrarian?

Sentiment on StockTwits is often telling.  Currently traders are bullish on defensive sectors such as utilities, consumer staples and healthcare.  Traders are very bearish on the broad S&P 500, Nasdaq and especially small caps.  This is after a huge rally of the Feb lows.  I think it's best to be contrarian at this juncture.


Friday, November 14, 2014

Internet Stocks To Lead NASDAQ To New Highs In 2015


The internet stocks are showing relative price strength after a year of price consolidation and will likely lead the NASDAQ to new highs in 2015.  The largest companies by market cap in the Dow Jones Internet Composite index are listed above.  Notice that Facebook (FB) and Google (GOOGL & GOOG) make up approximately 20% of the index alone.  Google has been moving sideways for the majority of 2014 and I think is modestly valued relative to other technology companies.  FDN is the largest ETF that tracks this index.

Monday, November 10, 2014

Microsoft Is Taking Off Like It Did In The Early 90s


Microsoft (MSFT) recently passed $400B in market cap.  Just by looking at the above chart, it appears to be in a long term uptrend similar to that of the early 1990s.

Sunday, November 2, 2014

Biotechnology & Health Care Stocks & ETFs Continue To Lead The Stock Market Higher


Biotechnology and health care stocks and ETFs continue to lead the market.  This is becoming a dominant theme within the broad technology sector.  It is likely that health care and biotechnology stocks continue to grow in relative market cap weight in the major US indices (i.e. NASDAQ 100 & S&P 500).

Tuesday, August 13, 2013

NASDAQ 100 Big Cap Tech To Outperform

Mega cap tech stocks have lagged the broad NASDAQ and the S&P 500 for many months.  Recent market action suggests that this could be changing.  Apple makes up 12% of the NASDAQ 100 Index alone.  A new uptrend for the world's largest technology company by market cap would pull the NASDAQ 100 Index into the lead. It's also worth noting that other tech giants like MSFT, CSCO, INTC, AMZN and GOOG also have bullish charts.  Follow the QQQ.

Has Apple Begun A New Leg Up?


Carl Ican's announcement today may have been the reason Apple was up almost 5% today, but it wasn't the only reason.  Apple has been undergoing accumulation for months as it built a base similar to 2008-09.  Today was merely the breakout.  If its chart follows a similar path set in 2009, Apple could pass $1000 quite easily.  With a P/E < 10, it is one of the most undervalued technology companies in the NASDAQ 100.

Thursday, August 8, 2013

Microsoft Is The Most Underrated Tech Company


While analysts like to continually make reference to Apple's large $30B cash reserve, they seem to overlook the fact that Microsoft has more than double that.  With $76B in cash and growing, Microsoft has more in cash than the total market cap of most companies in the NASDAQ 100 Index.  It has also increased its revenue and profit year-over-year with little upside response in its stock price.  I think Microsoft will surprise the market with a significant upside breakout sooner than later.  Like many first dot.com generation tech companies, its stock price has gone nowhere for >10 years.  It's a bargain at this price.

Sunday, July 28, 2013

Long Term NASDAQ Outperformance Began In The Late 1970s


There are many market similarities between present day and the late 1970s.  The late 70s early 80s saw the conclusion of a long secular bull market in commodities, similar to the late stage bull market in commodities we are currently experiencing.  One of the most overlooked comparisons between now and the 70s market is the relative outperformance of the NASDAQ.  Prior to the emergence of the broad secular bull market in the early 1980s, the NASDAQ was well on its way as early as 1978.  We are seeing a similar trend develop in the market today, however, the outperformance of the NASDAQ began immediately off of the market bottom in 2009.

I'm long the NASDAQ 100 Index through the QQQ.  It is my favourite "buy it and forget about it" holding.  I've been adding to it since 2006.

Thursday, July 25, 2013

Facebook Explodes Higher On Very Heavy Volume


Facebook has exploded, up almost 28% today on VERY heavy volume.  There are days when the entire Toronto Stock Exchange trades less than half of the volume Facebook has traded today (and the day is not over).  LinkedIn is up strongly in sympathy.  QQQ and especially FDN are up as a result.(Disclaimer:  I own FDN and QQQ)

Wednesday, July 24, 2013

Is Apple Preparing For Another Leg Up?


Apple is up in the premarket today after reporting earnings that we're not quite as bad as analysts had suggested after many downward revisions.  The market has responded modestly and it should open up ~5% today.  Whether or not it holds is another story and is largely dependent on the broad market.  Regardless, the market has more or less written Apple off completely.  With almost $400B in market cap, a P/E of 10 and a dividend yield of 2.8%, the market is pricing it like a utility company not a tech company.  Over the past several months, it has formed a base pattern similar to that in 2009.  Maybe I'm just seeing things...

Saturday, July 20, 2013

NASDAQ Outperforms The DJIA And S&P 500 2:1 Over The Long Term


Even after taking into account the dot-com bubble which reduced the NASDAQ by 78% from top to bottom, the NASDAQ still manages to outperform the DOW and S&P 500 by 2:1 over the long term. This chart says it all.

Thursday, September 2, 2010

NASDAQ Confirms New Rally

According to Investors Business Daily, yesterday's market action, particularly on the NASDAQ, confirmed that a new rally in the stock market has begun. It will be important to watch carefully for distribution during the next several business days to ensure the rally will not be a false positive.

There are some important characteristics about this follow through that make the staying power of this rally more compelling. The market began its institutional accumulation on Friday with significantly higher volume. It then traded lower for the following 2 trading sessions on very low volume and followed through with significantly more accumulation volume yesterday. This is a classic 4 day rally attempt and success that has lead to some of the strongest and lasting rallies in history. Although there is no guarantee that this rally will be one of those great rallies, it has potential.
To ensure this rally's survival, the NASDAQ and leading stocks must continue to lead the market. The DOW and S&P 500 should follow through in the near future, adding to the overall market strength.
The NASDAQ July low of slightly below 2100 points and subsequent August retest of this low may prove to be the last time this index ever trades at these levels.

Thursday, August 19, 2010

Where is the market headed?


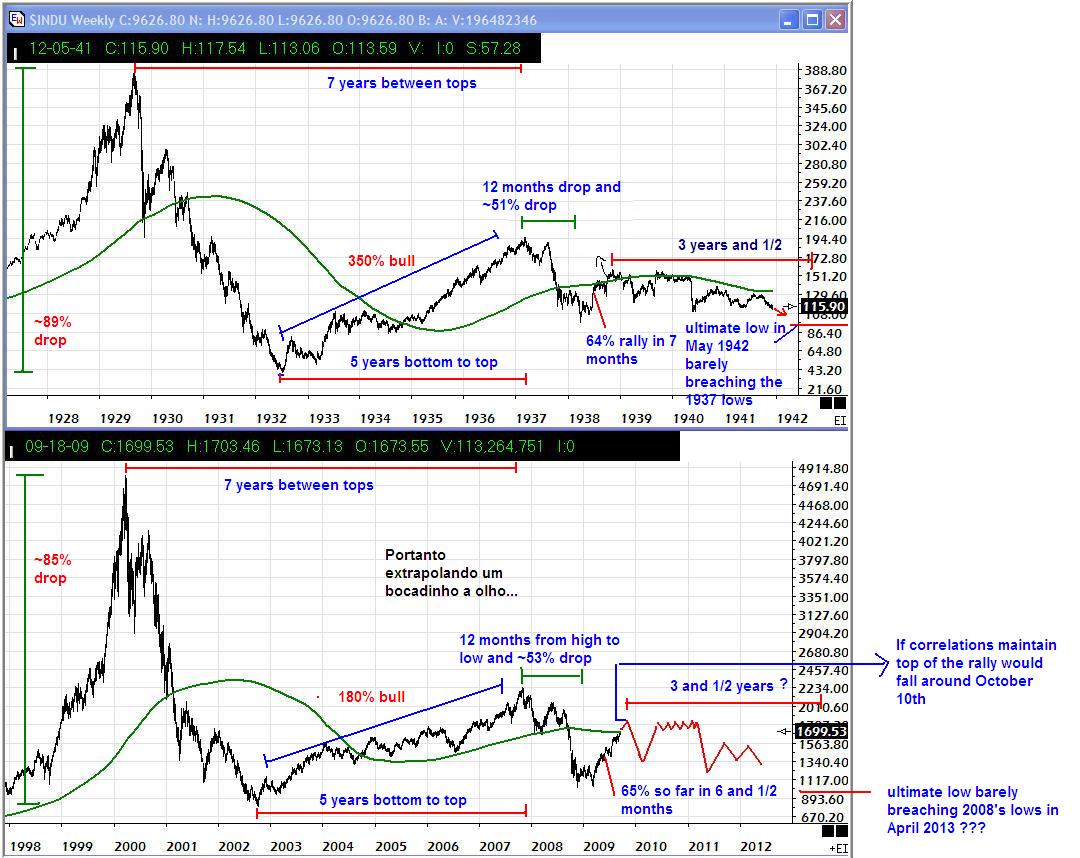
It is remarkable how much the 1930s DOW chart resembles the NASDAQ 2000s chart. The boom and bust nature of the roaring 20s and the technology boom of the 80s and 90s illustrates the fact that human psychology remains at least one constant in the stock market.

From their inception, both the early DOW and NASDAQ experienced years of uninterrupted growth before making their final parabolic moves and then subsequent crashes. The DOW took 12 years to fully "correct" before resuming a long term uptrend that began in 1942. We are 10 years into the NASDAQ's long term period of price consolidation. The real question is how much more time is required for the NASDAQ to fully consolidate and are we headed lower first?

One striking difference between these two charts is the magnitute of their second bull run after their massive crashes. After correcting 89% from its peak, the DOW broke out of a 3 year base pattern and moved up 380%. The DOW subsequently came back to test the 100 point level in 1938 and one final time in 1942 after which a long term uptrend resumed. The NASDAQ, however, moved up a mere 180% after its crash only to break support and retest its crash lows in 2009.

What does this mean? After a significant 380% rebound, it took two retests of the 1935 break out level support at ~100 to wash out all weak investors and the DOW to finally break out in 1942 and never look back. With respect to the NASDAQ, all of the weak holders were washed out in 2008 by a near retest of the 2002 crash lows. A second retest of the 2002 crash lows is unlikely. Support is more likely to hold near 2000 points or slightly below this level. The chart above suggests the NASDAQ will lack direction and drift to the old lows. I don't think so but anything is possible.

So perhaps it takes a year or two more before the NASDAQ defines itself as the true market leader once again. What's more important is the long term uptrend that will follow. In approximately 60 years, the DOW surged 1000% or two exponential steps. It stood at 100 points during the 1940s, moved up by one exponential step to 1000 points during the 1970s, and subsequently moved by another exponential step to 10 000 points by the year 2000. Each exponential move required approximately 20 years to complete, followed by a 10 period of price consolidation.

The NASDAQ currently sits at ~2000 points. By 2020 the NASDAQ should make one exponential step to 20 000 points and then enter a period of price consolitation during the 2030s. The uptrend will then resume in approximately 2040 with the NASDAQ reaching a remarkable 200 000 points, a second exponential step, by 2060 give or take a few years.

What's more interesting is where the other indicies will be given these time frames. Following the same trend, the S&P 500 and DOW shoud reach 10 000 and 100 000 points respectively by 2030. The following exponential step would bring the S&P 500 to 10 000 points and the DOW to a whopping 1 million points by the year 2060.

Sounds silly right? Imagine, how many people would have believed you if in 1942 with the Great Depression fresh in the entire world's mind, you made a prediction that the DOW which then stood at a mere 100 points, would reach 10 000 points by the year 2000?

This is the nature of exponential growth.