Option buyer sentiment is at 2009 levels. Is it too optimistic to expect a rally as significant?
Tuesday, April 12, 2016
Too late to turn bullish on oil?
Although the media has "turned bullish" on oil, I wonder if this sentiment is a sign of a short term top. I think the OPEC news is largely irrelevant. We are awash in oil. From a technical perspective, both WTI & Brent are approaching short term overhead resistance.
What are the stock charts of Canadian banks saying?
I must admit that I'm worried about the Canadian banks. Not withstanding all of the risks surrounding the Canadian housing bubble, they're overvalued when compared to their US and especially European counterparts by at least 50%. P/E and P/B ratios suggest this nearly across the board. The risks associated with the Canadian real estate market is the single reason why I have no Canadian assets other than my primary residence. The charts of the Canadian banks are difficult to interpret. RY & TD are of course the strongest and have held up best over the past 2 years. But this could be a "flight to supposed safety" as Canadian investors move further into the "safer" banks. The downtrend the bank charts show doesn't look as severe as the early downtrend prior to the financial crisis but they do illustrate concern among investors. They continue to post lower lows at a slow grinding pace - 2 years and counting. Unfortunately, when it comes to downtrends, the most pain is usually felt at the end. I'm sitting this one out.
Monday, April 11, 2016
Bearish sentiment is reaching extremes in some areas of the market. Is it time to be contrarian?
Sentiment on StockTwits is often telling. Currently traders are bullish on defensive sectors such as utilities, consumer staples and healthcare. Traders are very bearish on the broad S&P 500, Nasdaq and especially small caps. This is after a huge rally of the Feb lows. I think it's best to be contrarian at this juncture.
Where does the Canadian dollar go from here?
The $CAD has been rallying hard off the bottom after collapsing to 68 cents US in late Jan. As the long term chart shows, the $CAD has crashed faster and fallen further than almost anyone would have predicted. After such a crash, dead cat bounces and the development of subsequent trading ranges are almost inevitable (it's not going to zero nor it is it going to rebound significantly anytime soon). Fundamentals do not support a strong Canadian dollar nor a strong oil price on which it is heavily dependent. If history is any guide, both oil and the $CAD will remain depressed for a long time. Technically speaking, the $CAD is hitting solid overhead resistance around 78 cents. I suspect an intermediate term trading range develops between 72 and 78 cents for the next several months.
Labels:
$CAD,
Canada,
Canadian dollar,
oil,
technical
Print Your Own Medicine?
I thought this was very interesting. 3D printing is evolving exponentially and is destined to disrupt the pharmaceutical supply chain.
Will small caps outperform through 2016?
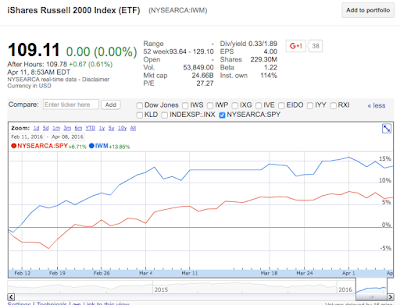
The Russell 2000 has lagged the S&P 500 since early 2014 - approximately 2 years. Similarly in 2011, small caps turned down first prior to the Euro Debt Crisis induced mini bear market. The 5 year chart shows that small caps have lagged the S&P 500 significantly. These trends don't last forever. Small caps are usually the first out of the gate during a market uptrend and the first into the tank during a market downtrend. If one were to assume that the bad news is now behind us and the market will begin to price in future growth, small caps should lead at least for short term and intermediate term. Since the market bottomed in Feb, small caps have been leading the S&P 500 by a 2:1 ratio - significant early outperformance.
Labels:
bear market,
bull market,
iwm,
leading,
outperformance,
s&p 500,
small caps,
spy
Subscribe to:
Comments (Atom)


